Rationale:
Our team has decided to do a correlation study which involves scale data. Hence, the Pearson's product moment correlation coefficient test was chosen.
Our study has verified the 4 assumptions for Pearson's r.
1. All observations must be independent of each other.
This assumption was verified by the random sampling method that we chose: Stratified proportional sampling.
2. The dependent variable should be normally distributed at each value of the independent variable.
This assumption was verified by the box plot.
3. The dependent variable should have the same variability at each value of the independent variable.
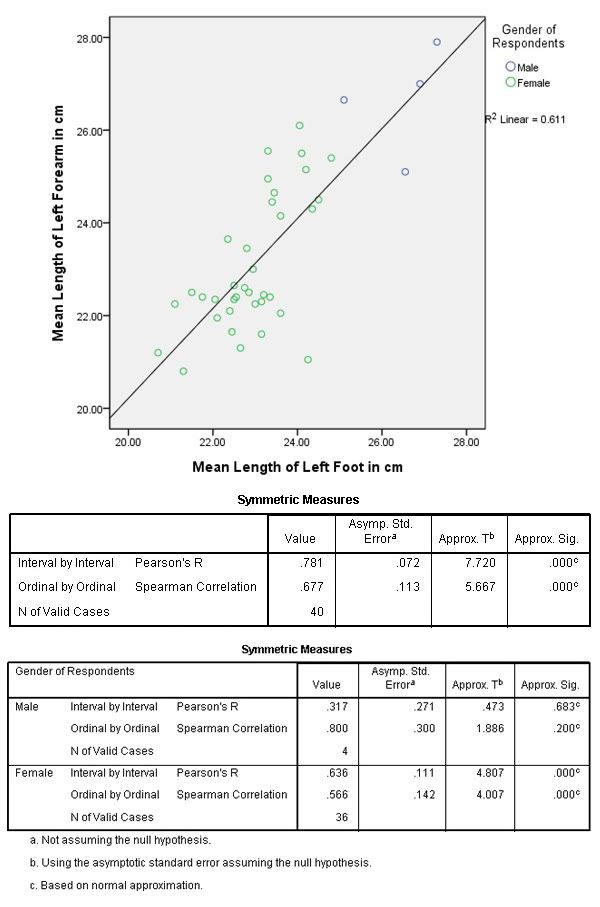
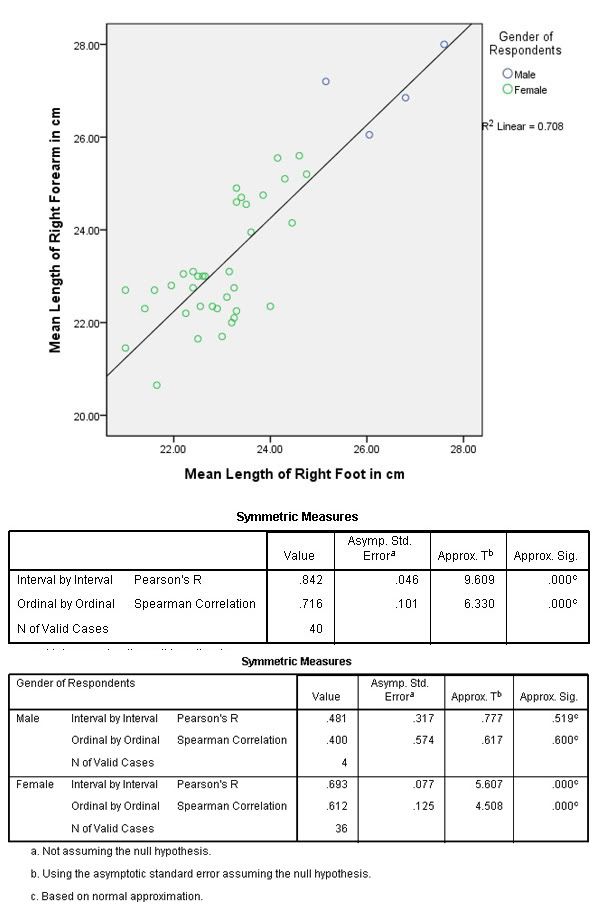
This assumption was verified by the scatter plot.
4. The relationship between the dependent and independent variables should be linear.
This assumption was verified by the scatter plot.
Results:
1.1. There is a positive, strong and significant association between a female's right forearm length and right foot length. (r=0.693, p<0.05, N=36)
1.2. There is no relationship between a male's right forearm length and right foot length. (r=0.481, p=0.519>0.05, N=4)
1.3. There is a positive, strong and significant association between a female's left forearm length and left foot length. (r=0.636, p<0.05, N=36)
1.4. There is no relationship between a male's left forearm length and left foot length. (r=0.317, p=0.683>0.05, N=4)
Final Statement:
Reject null hypothesis.
There is a positive, strong and significant association between forearm length and foot length.
-->Right forearm and right foot: r=0.842, p<0.05, N=40
-->Left forearm and left foot: r=0.781, p<0.05, N=40
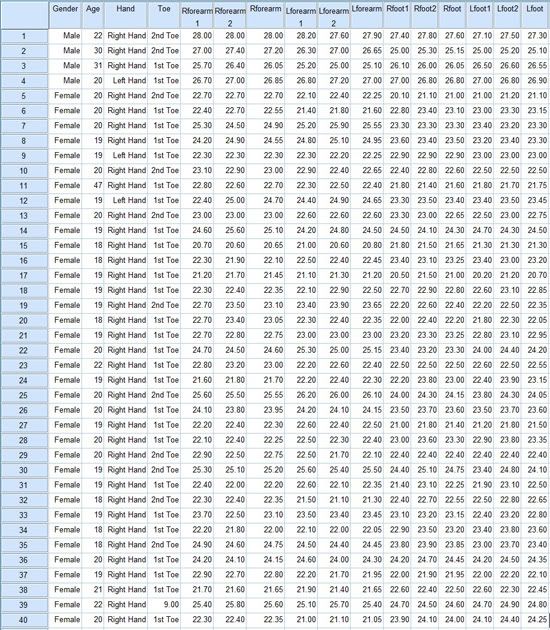
Raw Data
Scatter Plot of Right Forearm Length and Right Foot Length
Scatter Plot of Left Forearm Length and Left Foot Length